
Wednesday, August 29, 2012

No Recession then When?

Monday, August 20, 2012

Sunday, August 19, 2012
Nifty Outlook, Tuesday 21, 2012
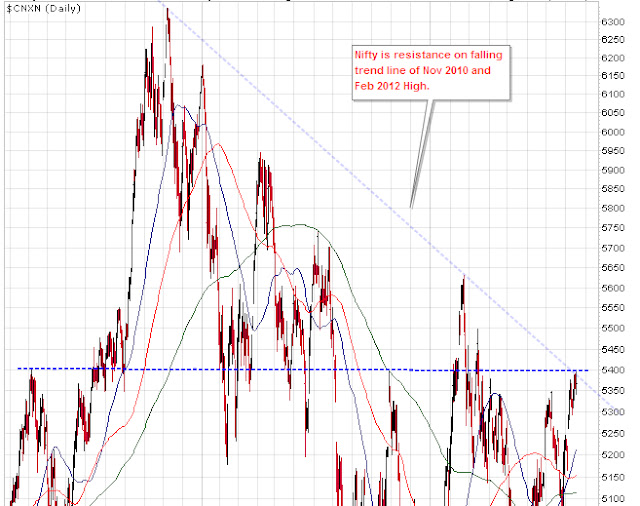
I posted the following possibility of nifty resistance on July first week. It took little late to reach there and now a down move is more prominent.
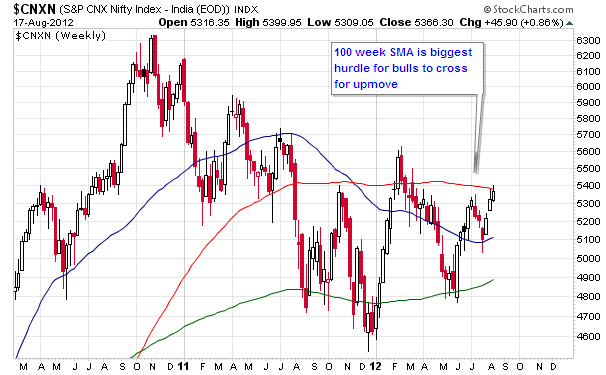
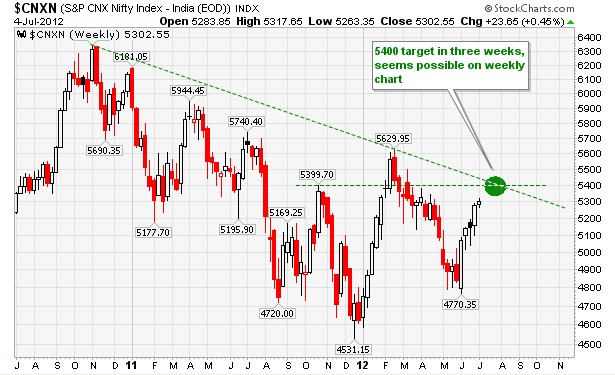 Now both the resistance (falling & static) and 100 week SMA is producing strong resistance at 5400.
 5250 to 5266 is first possible support zone. Short trader may book first profit at this level.


Thursday, August 16, 2012
5365 is crucial for today

Wednesday, August 15, 2012
PE ratio and S&P 500

However, the historic data based on P/E5 suggests that we are experiencing a new bull market which may continue for quite a few years, which is the same conclusion arrived from the trough formation of the 50- and 200-month moving average of the S&P, an entirely unrelated indicator.

Tuesday, August 14, 2012
SPY volume

The dashed black line shows the average of each of the past six data points for August 10 since 2007 (in 2008, August 10 was a Sunday, so I used the 11th). The dashed pink line is the simple average of all data points on the chart. August 10 of last year was near the beginning of the meltdown into the October low -- and volume was fairly high. Even if you eliminate that particular August 10, the average is still higher than the pink line of all volume. I think we can safely reject the "summer doldrums" as the reason for light volume during the past week.
The green arrows mark the volume around the Christmas holidays each year, which is almost always a time of light trading. Of the 5 past holiday periods, the moving average of volume went below 100 million shares per day 3 times. The red arrows mark the only other times during the past 5 years that volume dropped below 100 million: the market peak of 2007, and now. Unusually light volume showed the reluctance to buy at the peak in 2007 -- and appears to be showing that same reticence now. Technical analysis is essentially studying the behavior of all market participants collectively.
Fund managers, analysts, and the individual investor can say anything they like, but what their behavior shows is that (except for 3 out of 5 Christmas holiday periods) the only other time they were this reluctant to commit funds was at the peak in 2007. I think this argues rather strongly that we are at or very near to an important market top. The S&P is less than 1% below the high from April 2 of this year. Whether we exceed that peak by a little or not is probably unimportant for this volume study.
Original content: SPY
Are you short on Nifty?
Are you short on Nifty? The question was popped up to me from one of my friend and critic. I was sure where he is trying to bring my notice. I replied "Yes". I am a technical player and he a positional trader. I was short as per my previous post and continue my positional advise. Ofter a trader lose money when he is very close to winning situation. Technically Nifty is in overbought, which is not one point. However when Nifty in such situation moved against our thought it only test our believes.
Let's see where your believe lies.
Let's see where your believe lies.
Thursday, August 9, 2012
Nifty shown early sign of down move


- Nifty touched Monthly pivot and coming down
- Corrective move seems complete at 5377
- Bollinger band upper band could not be crossed
- Nifty created shooting star at top of a rally which is very bearish
- Volume is still missing at higher level
Wednesday, August 8, 2012
Nifty intraday update

Nifty Range for August 8, 2012


Nifty range should be weekly pivot, and today Bulls need to protect second pivot of the week i.e 5312, else Nifty may target 5266 again and then obvious target would be 5200 next week.
Dow has formed shooting star at top of a rally, hence expect it to trade lower in short term, this will effect our Nifty to follow the suit.
Less volume at higher level suggest less demand, smart money is waiting for breakout and opportunists are waiting for a dip.
Nifty Mirror Image

Going by the this image, we can expect sharp down move below 5000 then consolidation of 9 to 15 days before moving sharply above 5500.
Image is self explanatory, please go through it.
Tuesday, August 7, 2012
Sensex and Nifty movement on August 7
"Hammer-like candle can be positive on strength above its head." Aided by positive Global cues, Index traded gap-up above the Hammer, and finished 215 pts or 1.2% higher. Oil&Gas Index, thanks to
RIL's 5.6% gain, shot up 3%. Dollar-based indices outperformed on Rupee strength, and A/D ratio turned positive 2:1.
The action formed a Bull candle with a 105-pt gap-up area below its bottom. While the gap-up area 17208-313 is a technical support, the gap down area of 12th Jul at 17329-467, and 17500-600 are technical resistances. After strong gains yesterday, watch if the action cools down at the said resistances, or ..
Future premium reduces from 25 pts to 14. Gap-up action attempting to cover the gap-down area of 12th Jul. Reverse fails to reach/sustain above 5310-20.
Monday, August 6, 2012
Nifty Intraday Movement for August 6
"bias would be negative if the Index weakens and closes below the candle." Opening gap-down, Index weakened below the candle. However, refusing to close below it, Index recovered later to end only 26
pts or 0.1% lower. While other sectors finished mixed, Metal Index lost 1.6%. The A/D ratio ended negative, at 1:2.
The action formed a Counter Attack Bull, a Hammer-like candle with a long lower shadow. The shadow indicates intra-day bounce from the 200- day EMA. Such a candle can be positive on strength above its head. Watch, however, if the strength maintains beyond the morning session. Strength above 5166 would indicate a positive structure
Future premium increases from 19 pts to 25 Bounces intra-day from lower end of blue parallel channel
Reverse fails to reach/sustain above if holds 5280-90.
Friday, August 3, 2012
Nifty Trading level for August 3

For today, Nifty support seems at 5150 to 5170 zone, risk takers may go long with strict stoploss of 5140.
As per Bramesh Nifty Future trend deciding level is 5187 and Nifty trend changer is 5105. Above this level, bulls will rule, below this level bears have upper hand.
Thursday, August 2, 2012
Nifty outlook August 3 Friday


Dow Jones Update

US stocks opened lower on Thursday following disappointing comments from Mario Draghi, the president of the European Central Bank.
At a press conference, Draghi said the ECB would draw up a mechanism in the coming weeks to make outright purchases to stabilize stressed euro zone borrowing costs. The statement disappointed investors who had been hoping for strong action following his recent comments to "do whatever it takes" to save the euro.
The Dow Jones industrial average was down 56.99 points, or 0.44%, at 12,914.07. The Standard & Poor's 500 Index was down 7.82 points, or 0.57%, at 1,367.32. The Nasdaq Composite Index was down 22.99 points, or 0.79%, at 2,897.22.
FTSE update

Nifty Intraday Movement August 2

"bias can remain positive if trade sustains above the candle." Index mostly maintained above the candle, but ended only a marginal 21 pts or 0.1% higher. Healthcare Index outperformed, up 1.3%, and broader market also did well. Small/Mid-cap Indexes ended 1% higher, due to which, the A/D ratio ended at positive 2:1.
The action formed a High Wave, a candle with a small body and shadows on both sides. It indicates strength of last three days is moderating at higher levels, closer to previous high of 5268 and gap-down area. Move
above 5268 by Friday would be watched for faster retracement of fall. Failure could indicate lackluster structure.
Future falls into discount of 4 points from premium of 12. Testing previous high of 5268 and gap-down area 5280-5313. Reverse if holds 5240-45 or 5225-30.
Action : Sell in the range of 5268 – 5273
Targets : 5235 / 5215 / Lower
Action : Sell in the range of 5268 – 5273
Targets : 5235 / 5215 / Lower
Stop-loss : 5283
Wednesday, August 1, 2012
Bernanke's Dogs

read full article
Nifty Daily Analysis

"After strong gains, watch if the action sustains above the candle after RBI policy." Index traded volatile around RBI policy. Down 205 pts from initial highs, it later recovered 250 pts, and ended 93 pts or
0.5% higher. Oil&Gas and Realty Index gained 1 to 2%, and the A/D ratio ended on a marginally positive note.
The action formed a Hanging Man, a Hammer-like candle with a longer lower shadow. The lower shadow stands for the late support, which wiped off the initial loss. The high of the candle touches 61.8% of the
preceding fall. Despite which, however, the bias can remain positive if trade sustains above the candle. Subdued otherwise.
Future premium reduces from 17 points to 12
Dip after RBI policy maintains above the falling resistance line Reverse if fails to reach/sustain above 5240-50
Monthly Nifty Movement Aug 12


Nifty Range for August 1

Today, Nifty may find very tough to cross 5252 and would give good opportunity to short Nifty.
Weekly pivot is 5100 hence it would give good support in near future (at least for this week).
No trade advise in 5252 to 5225 and if nifty do not sustain 5225 level then next target would be 5210 followed by 5180 and 5164
Subscribe to:
Posts (Atom)