Friday, July 27, 2012

ATR Calculation @ Nilesh Deshpande

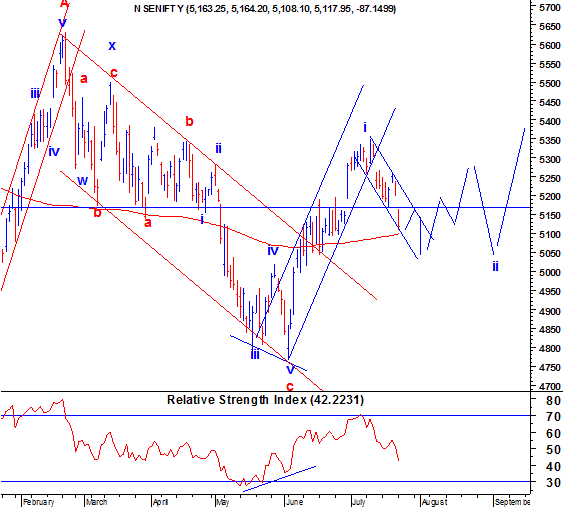
 I was waiting for 5065 to be broken as it was yesterday's close (5110 - 57*0.8) where 57 is ATR at yesterday's close.

Normally in absence any adverse conditions, this range of previous close - ATR *0.8 holds as lows and highs.

Once the range breaks on either side, the day's extreme, (in today's case the DH) minus the ATR *1.5 is the next logical stop.

In case of a upwards break out, this becomes DL +ATR * 1.5

ATR works on most days, but not on all days.

My formula is simple.

PC-ATR*.80 to PC-ATR*0.50 Buy Zone

PC+ATR*0.50 to PC+ATR*0.80 Sell Zone

where PC is previous day's close.

Bears get weak near PC-ATR*0.50 to PC-ATR*0.75, but get charged up below PC-ATR*0.80 for a target of DH-1.5*ATR

Bulls get weak near PC+ATR*0.50 to PC+ATR*0.75, but get charged up above PC+ATR*0.80 for a target of DL+1.5ATR

where DH & DL are current days High & Low respectively.

Gives out better results when used with ADX for determining whether this is a trending or a sideways market.

Thursday, July 26, 2012

Nifty Forcast on Chart

I found a a very interesting chart on Elliot Wave Blog, where in it has been predicted how Nifty should behave in comming week. Today it behaved excatly point to point as predicted. This only shows power of analysis.

Why this Sell a wary, sellawary di...!!

What sparked the sell-off in midcap companies' shares today

Talk in the market is that a couple of brokers who are facing a liquidity crisis have sold pledged shares of companies, triggering a sell-off in the shares of nearly a dozen mid-cap companies.

Last year in November, stocks of many mid-cap companies fell as much as 50% as many non-banking finance companies dumped shares pledged by promoters with them. The promoters had raised money from these NBFCs by pledging* their shares, and when the promoters failed to put up the additional margin because of a decline in their stock price, the NBFCs sold the shares in the market to recover their dues, aggravating the slide.

A few promoters nearly lost control of their firms because of their holdings decreasing. And even though the NBFCs dumped the shares at the first sign of trouble, some of them could not recover their entire principal because of the precipitous fall in the share price. After this unpleasant experience, NBFCs tightened their lending norms and would not easily give loans to promoters of mid-cap companies against shares.

read full story here


Wednesday, July 25, 2012

Nifty formed Hammer

Nifty has formed hammer in downtrend (same is called hanging man if formed in uptrend), which is a bullish sign of great promise. in last one year, it has formed 8 such candle including one in uptrend. Rest all the time it has been in downtrend which was followed by at least 3 bull days. Now we can expect 100 point rise till Tuesday morning next week.
Note: never discount global cue

Tuesday, July 24, 2012

Thank God I’m a trader, not an analyst!

There is a huge difference between being a trader and being a market analyst.
Analysts are paid by being right. On this basis alone I am not smart enough to be an analyst. Traders are paid by managing risk. These two skill sets are a world apart. In my experience, people who try to be traders by being analysts usually lose their grip at both ends of the rope.
An analyst will be judged negatively by poor market calls. When wrong, a trader closes the trade and moves onto the next opportunity. Hopefully, little harm done! Being wrong is a fundamental assumption for a trader.
Analysts study industries, companies and economic conditions. Traders, at least most traders, study price and could care less what company the price represents.

click here to read full story

July 24, trading range


CMP : 5120.40
Comment : Future premium goes down from 12 points to 2. Breaks 200-day EMA with a gapdown action.
Reverse if fails to reach/sustain above 5140-50.
Action : Buy in the range of 5090 – 5095
Targets : 5130 / 5150 / Higher
Stop-loss : 5080

Sunday, July 15, 2012

The Olympics 2: Predicting Olympic Medals

Goldman are now finally ready to unveil our predictions for London 2012. Table 3 (Above) shows their forecasts for medals in London 2012—gold on the left-hand side, and total number of medals on the right-hand side. In each case, they also show each country’s medal attainment in Beijing 2008, and the difference between the 2012 forecasts and the latter (a positive number means we expect the country to win more medals in 2012 than were attained in 2008).

Friday, July 13, 2012

US Initial Jobless data claim

US initial Jobless Data has been improved a lot and currently staying at 4 year low.
The number of Americans initially applying for unemployment aid last week dropped to the lowest level in four years after remaining at a high level for months, the US Labor Department reported Thursday.

Indian Rupee @ 56.30

Indian Rupee may found stiff Resistance at 56.30

Wednesday, July 11, 2012

Expect a healthy correction

We can expect a healthy correction now in the zone 5360 to 5380, to know why? see below

Important event @ July 2012

I have mentioned some very important economic events, which may provide new direction to Indian and global market
For UK
2-Jul PMI Manufacturing
3-Jul PMI Construction
3-Jul Net Consumer Credit
4-Jul PMI Services
9-Jul Lloyds Employment Confidence
10-Jul Industrial Production (MoM)
10-Jul Industrial Production (YoY)
10-Jul Manufacturing Production (MoM)
10-Jul Manufacturing Production (YoY)
17-Jul Retail Price Index
18-Jul Bank of England Minutes
18-Jul Jobless Claims Change
18-Jul ILO Unemployment Rate (3mths)
18-Jul Employment Change (3M/3M)
19-Jul Retail Sales Ex Auto Fuel(MoM)
19-Jul Retail Sales Ex Auto Fuel(YoY)
19-Jul Retail Sales w/Auto Fuel (MoM)
19-Jul Retail Sales w/Auto Fuel (YoY)
20-Jul Public Sector Net Borrowing
23-27 JUL CBI Reported Sales
24-Jul BBA Loans for House Purchase
25-Jul GDP (QoQ)
25-Jul GDP (YoY)
25-Jul Index of Services (MoM)
30-Jul Net Consumer Credit
30-Jul Net Lending Sec. on Dwellings
30-Jul Mortgage Approvals
31-Jul GfK Consumer Confidence Survey

For USA
10-Jul Consumer Credit
11-Jul Wholesale Inventories
11-Jul Minutes of FOMC Meeting
12-Jul Initial Jobless Claims
12-Jul Continuing Claims
12-Jul Bloomberg Consumer Comfort
12-Jul Monthly Budget Statement
13-Jul Producer Price Index (MoM)
16-Jul Business Inventories
17-Jul Consumer Price Index (MoM)
17-Jul CPI Ex Food & Energy (MoM)
17-Jul Consumer Price Index (YoY)
17-Jul Consumer Price Index NSA
17-Jul Industrial Production
19-Jul Initial Jobless Claims
19-Jul Bloomberg Consumer Comfort
19-Jul Bloomberg Economic Expectations
19-Jul Philadelphia Fed.
19-Jul Existing Home Sales
19-Jul Existing Home Sales MoM
25-Jul New Home Sales
25-Jul New Home Sales MoM
26-Jul Durable Goods Orders
26-Jul Initial Jobless Claims
26-Jul Continuing Claims
26-Jul Bloomberg Consumer Comfort
26-Jul Pending Home Sales MoM
26-Jul Pending Home Sales YoY
27-Jul GDP QoQ (Annualized)
27-Jul Personal Consumption
27-Jul GDP Price Index
31-Jul S&P/CaseShiller Home Price Ind
31-Jul Consumer Confidence

For China
July 9 Consumer Price Index (YoY)
July 11-15 Foreign Exchange Reserves
July 13 Industrial Production YTD YoY
July 13 Industrial Production (YoY)
July 13 Real GDP YTD (YoY)
July 13 Real GDP (YoY)
July 13 Retail Sales YTD YoY
July 13 Retail Sales (YoY)
July 14-18 Actual FDI (YoY)
July 22-25 HSBC Flash Manufacturing PMI
July 27 MNI July Business Condition Survey

For India
July 9-12 India Local Car Sales
July 12 Industrial Production YoY
July 13 Monthly Wholesale Prices YoY%
July 18 CPI (YoY)
July 31 Reverse Repo Rate
July 31 India REPO Cutoff Yld
July 31 Cash Reserve Ratio

Thursday, July 5, 2012

Nifty range and target for July 5, 2012


CMP : 5322.65
Comment : Future premium up from 18 points to 20. Trades in a sideways range for the 3rd day in a row.
Reverse if holds 5300 or 5270.
Action : Sell in the range of 5334 – 5339
Targets : 5305 / 5285 / Lower
Stop-loss : 5349

Nifty @ July 5, 2012


Visit StockCharts.com to see more great charts.
  1. Nifty has formed three doji lines which shows indecisiveness, however till now it is more bullish than bearish because each time bulls manage to close positive. 
  2. Slow stochestic is in overbought zone for the last 20 trading sessions, which may opt for correction for rest of the weeks, or say, before moving higher till 5390 or above.
  3. 5302 is also important as it is 61.8% retrenchment of Feb 22 high and June 4 low.
  4. If a correction would happen it should not breach 5200 level and if Nifty give a breakout above it will be restricted till 5390 for the remaining week.
  5. Trendline joining Nov 11 high and Feb 12 high indicates possibility of 5400. Chances of upper breakout did not seems this week as it is good resistance matching with Oct 11 high.
  6. Europe did not perform after so called big news of eurozone debt crisis which suggest more weakness and hence our market also get affected.

Tuesday, July 3, 2012

Nifty Future range July 3, 2012


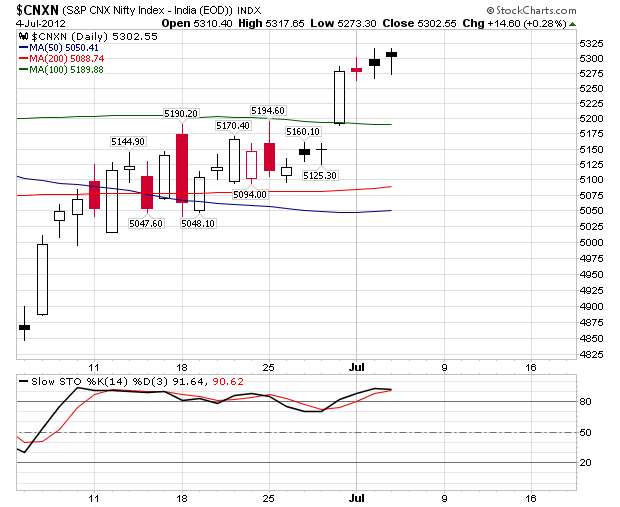
Future premium reduces from 18, points to 17.
Small Bear candle indicates limited, amount of profit-booking. Reverse if fails to reach/sustain, above 5325-35.
Action :
Buy in the range of       5275 – 5280
Targets :                       5310 / 5330 / Higher
Stop-loss :                  5265