Friday, April 27, 2012

Things to remeber

9 THINGS THAT WILL DISAPPEAR IN OUR LIFETIME!!!

Whether these changes are good or bad depends in part on how we adapt to them. But, ready or not, here they come.

1.
The Post Office
Get ready to imagine a world without the post office. They are so deeply infinancial trouble that there is probably no way to sustain it long term. Email, Fed Ex, and UPS have just about wiped out the minimum revenue needed to keep the post office alive. Most of your mail every day is junk mail and bills.

Nifty making Symmetrical Triangles


  1. Nifty should complete 5080 retrenchment before moving higher
  2. Trend line joining recent lows also pointing 5080
  3.  Nifty may give false break down of 200 SMA
  4. Nifty is in making of Symmetrical Triangle which is about to finish with corrective leg "C"

Expiry Day @ Abusama

Congratulation Abusama and thank you for predicting market so accurately for my readers in one week advance.
He revel further that his thought was around RBI policy which failed to boost market sentiment even after surprising rate cut of 50 bps.

I would request him to write for Niftymama on regular basis. I also request him to appear on you tube for his weekly market overview.

Thursday, April 19, 2012

Nifty outlook for Apr 20

Up Target2: 5380 to 5385 zone is 50% of retrachment
UP Target1: 5365 upper level of bollinger band
Resistance: 5337 is 50 DSMA; for the last two days Nifty has failed to sustain above this level
Down Support1: 5312 as this is 20 HEMA this may be first sign if bears break this level down
Down Support2: 5279 as this is 20 DEMA this may trigger sell off for short term
Down Target: 5266 to 5276 this may act as a very strong support because of clustering of too many moving averages

Trading range for tomorrow would be 5270 to 5380

Wednesday, April 18, 2012

Nifty outlook: April 18

 
Nifty is very much likely to break the long time trend line which started on Feb 22.
Amidst very positive global cue, Nifty should move only higher and higher today.
5310: confirmation of trend line breaking
5324: 61.8% retrenchment
5338: 50 DSMA
5365: Uppar bollinger band
5383: 50.00% retrenchment
5425: 100 WSMA
5310>5324>5338>5365>5383>5425
Please find below all the graphs

Tuesday, April 17, 2012

Nifty Intraday Analysis Apr 17

RBI has made a tendency to surprise the market time and again. Last time it declared CRR cut just after closing the market that too more than expectation. This time, going against all expecation of 25 bps rate cuts, RBI reduced it to 50 bps. Though global cue dampen the bullish force and force it to touch 5220 level again.  Europe open positive, it start moving slowing in up direction and stopped just before crucial resistance of 5300. We can see Nifty level to 5380 if crossed 5310

Sunday, April 15, 2012

WPI Data for April 2012

WPI data is expected to be around 6.7. The higher this number is the stronger the affect on consumer inflation. A higher than expected reading should be taken as positive/bullish for the INR. However it would not help Nifty getting higher because a good WPI number means RBI  will have a reason to shun any rate cut. This may trigger a set back on all those expectation of Dalal Streat.

5217 is crucial

5217 is January high and April closing need to be happen above it, else bears have clearly upper hand. Every bull market has confirmed the importance of January high.

Monday oulook

Nifty weekly is still trading above middle line of the channel. and most of the time it has traded around the upper trend line. If we exclude previous week trade because of only three day trading then last week was second week to trade only in around 100 point tight range since November 2011. One can easily expect violent movement of around 300 point above the trend line joining Feb high to last week high or 200 point down 200 SMA if close below 5145.

April Expiry

Today I asked my other two analyst friends to give some outlook on expiry of Nifty. and got the following outcome.
"Market is bearish for very short term and may see some consolidation in the rang of 5200 to 5300, Nifty may come down to 5150 in April and expiry is most likely between 5200 to 5300" as said to me by Analyst Abusama Shekh
and as per positional trader Pradeep Kumar market is most likly to expiry around 5300, but there is still some hope of touching 5350.
But I believe strongly that Nifty will bounce back from 5145 level which happen to be it's 200 SMA and it may rise to 5400 and expiry is most likely around 5350 to 5400.

Friday, April 13, 2012

Ghost of Friday 13th

It was not surprise for me, as I was expecting something unusual today. I also mentioned in my previous blog.
Ghost of Friday 13th is very much apparent today in world market. Every market is down with no concrete reasons. Many argue about Infy result causes Nifty down. But may I ask them if it was so, why Nifty did not plunge as soon result was declared. Why Nifty plunged in late afternoon, when it seems everything is fine, and market has discounted Infy result. Anyways, Nifty has respected the lower level of the channel of 100 points.
5200 has replaced the crucial level from 5260 with the type of closing. I believe market will bounce on Monday before clarification by RBI policy meet on April 17.

Thursday, April 12, 2012

IIP Data, how much to rely on it?

Analysts expressed concern at the revision in the January Index of Industrial Production numbers (IIP) from 6.8 per cent to 1.1 per cent, and the fall in February numbers.
Expectations of a rate cut from the RBI in its policy announcement next week have increased, experts say. 

Check list for Investors

It is easy to drown in the flood of information available in the financial markets. There's always one more report to read, one more press release to peruse or one more chart to interpret. In such an environment, it's easy to get pulled off course; information intended to help you, can actually make it difficult to maintain a consistent investment process.
Unfortunately, the market rewards disciplined investing and often quickly punishes emotional, distracted or disorganized approaches. What's more, it's easy to forget discipline when things are going especially well or especially bad. And then there's just human nature – humans are fallible creatures and even the best find it difficult to remember or replicate what worked three or four years ago.
SEE: Stock-Picking Strategies
Accordingly, investors should seek out ways to stay disciplined and methodical when it comes to researching new ideas, maintaining an existing portfolio and exiting positions. One of the best ways to achieve this is the use of checklists. Just as airline and military pilots have used checklists for decades to eliminate avoidable

Tomorrow, Friday 13, what it store for Nifty??

If you have any fear of Friday combining with number 13, mind it, it may prove correct as far as Nifty is concerned. Next one will be on July 2012. Last time it occurred on May 13, 2011 and Nifty was 1.07% up.
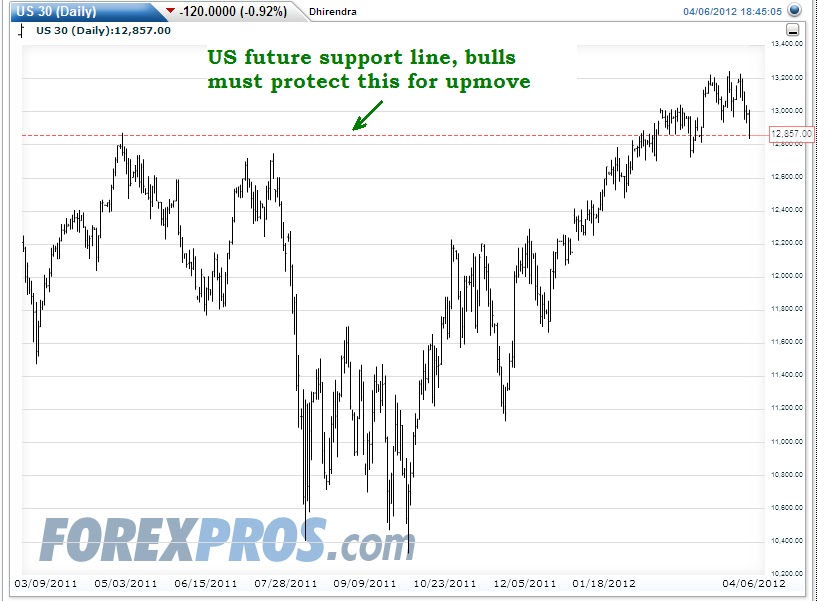
Volume was more and nifty range was also high compared to last seven days. But US was not as good as Indian market and it laid our nifty to shade all gains on coming week.
This time, Nifty is struggling at very crucial level 5260 to 5290. Also it is moving in a narrow range of 100 points for the last five days.
Everybody seems waiting for Infosys result and RBI policy review. Expectation is a 25 basis point cut in the policy repo rate next week, which would bring it to 8.25 percent. Today's IIP number did nothing to market as it is very volatile in nature and analyst doubt over it's accuracy. March WPI data is also due on Monday.

Nifty closing of below 5250 on weekly basis would only empower bears. and below 5200 more downfall can be predicated. Closing above 5310 has also limited upside till 5630 last rally high.

Nifty Intraday analysis by Illango Sir

Classic TA charts such as Macd, Rsi & stochastics show a potential reversal with rsi chart even having a price confirmation.
"5315"-WEma and R2 too same. A close above it is required to keep weekly trend up.
"5310"-Month Pivot.
"5307"-61.8% of last fall of 5379 to 5191. These are numbers to stay above for bullishness besides the JNSAR.
"5257"-intraday low will be the first weakness signal.

for full report click at Trade in Nifty only

Friday, April 6, 2012

US future support

Bulls must need to protect the support for moving up. It is very old support created by March 2011 high.

US Adds only 120K Jobs last month: US Future down

As soon US Job data released which was very poor compared to expectation, US Future suddenly down by 120 points at 6:00 PM IST. Forecast was of 218K actual comes only 120K
Nonfarm payrolls gained 120,000 workers in March, short of the 200,000-plus economists anticipated, leaving market watchers to ponder whether the miss is merely a hiccup or a harbinger of more disappointment to come. read full story

Inverted hammer in Nifty Future

Nifty has created an inverted hammer. Island reversal formed on April 4, has been nullified by this inverted hammer pattern and again it has been followed by a small doji with closing above 5300 in island pattern which suggest indecisiveness.

Nifty five hour chart

  1. Nifty Future has developed positive divergence in MACD
  2. Taking support at 38% retrenchment of long from 4531 to 4630
  3. If this is really a bull market then a flag formation in bigger horizon has been developed and poised for breakout.
  4. As per EW analysis, Nifty future has completed "C" of corrective wave II
Bulls task is to protect 5200 level for survival. Half task has been already completed by closing above January high, now we can expect more up move in coming month. My target is 5900 before August in the hope of rate cuts from RBI.

Nifty micro level analysis


Looking at All these charts bulls seems more in control and after some minor hiccups it will resume bull run phase.
  1. On Daily Nifty Future Chart, bullish flag formation can be noticed
  2. On Hourly chart Nifty has already made double bottom and now moving in bigger triangle with positive bias.
  3. On Half hourly chart Nifty future is taking firm support on 200 SMA with bullish crossover of 100 SMA and 200 SMA only worries is a bearish crossover of 50 SMA and 100 SMA (which is not so strong.


    Wednesday, April 4, 2012

    Wise words from Illango 002

    Part booking & re-entering comes only with experience.

    There are few methods to follow to reach there:

    1. Observing the price cluster points in an hour chart of 30 to 50 trading days would guide you on the likely price points such as the recent one being "5382".
    2. Understanding the maturity of an upmove/ downmove and the different T/F technicals would guide you to hold back on profit booking if the trend is still young. Hour TA with +ve or -ve div are good points to part book. 75 to 120 points away from the recent top/ bottom is a good place to re-enter. Re-entry should be avoided if a threat of reversal looms.
    3.Knowledge of EW helps to understand various kinds of wves/ retracement possibilities for part booking & re-entries.

    Tuesday, April 3, 2012

    Nifty technical for Apr 4

    1. Trendline is still intact which is a bearish sign
    2. Decreasing volume because of only three trading day this week
    3. Doji formation at top, that too with touching trend line, 
      Bulls need to close above the trending line, Nifty is in bull run in the speculation of rate cut. low volume is only because no fresh long is being created because of only three trading session, hence traders are taking is safe. Tomorrow resistance would be 5385 and support would be 5300, breaking the limit may show 5417 and 5250 level in short term.

    Hourly Nifty analysis

    Do not get carried away with overbought zone in different indicator. As Nifty opted for sidewise consolidation on last two previous occasion.

    Nifty Outlook for April 4, 2012

    Tomorrow opening below the trend line, joining 5145 to 5355 would favor bears in short term. Because Nifty is closed for Thursday and Friday, hence few would like to go in weekend with new position. Many would love to get into fresh buying in new week.

    Wise words from Illango 001

    When the day TA is uptrending, till it reaches overbought zone & starts to turn down, look at the price behaviour:

    How much pull back it does during the upmove. Use this information to re-enter.

    For eg:

    5136 to the current high, Nifty has pulled back to a maximum of 31-32 points only.

    Let Day trend gets exhausted with a close below DHEma. Now the correction would be more than 33 points and we would call it correction if weekly trend is in "uptrend".

    75 to 110 points correction would emerge once day trend becomes overbought.