
I found somthing very interesting which I want to share with you all.
On Nifty weekly chart SMA of 50, 100, 200 bars had crossed at same point in second week of December 2009, which in my views signifies long term bullish trend for Nifty.
On February 2010, price jumps from 200 days moving average and at same time it was also resting on 40 bars weekly moving average
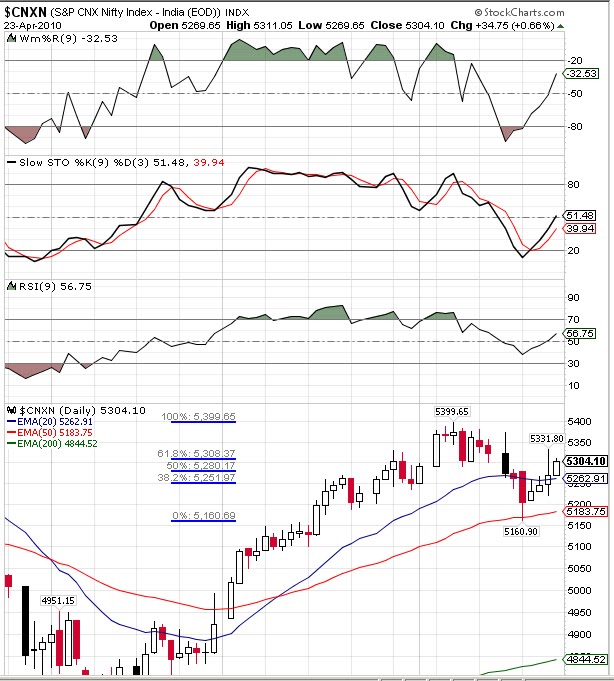
For Today April 7th 2010 my views is as follows
- RSI need to move above 70 for at least one week before taking downtrend
- Whenever William% rises sharply to oversold jone it need to wait for at least 3 to 4 bars before reversing; so in my views NIFTY position is intact above 5300 and it's target is 5410/5445/5477

 Nifty may open gap up amidth globle cue, and try to break 5280 (May open at this level or at 5264) Nifty most likly to break to triangle today. It may faces strong resistance at 5322


